Première plateforme logiciel pour visualiser et analyser simplement l'ensemble des données techniques de la vigne et du chai
Scroll down to content
Winery Platform
New software platform to easily view and analyze technical data from the vineyard and the cellar
Our solution for your technical data of the vineyard and the cellar
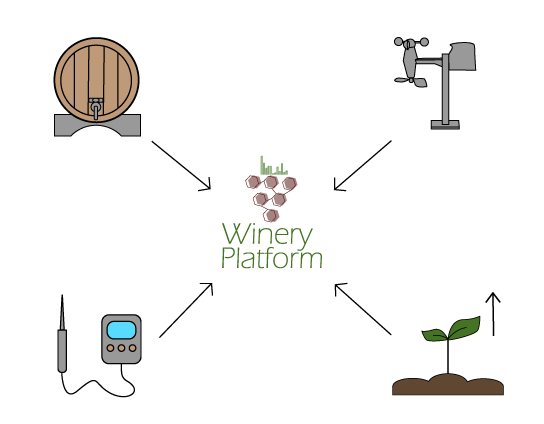
Centralize
Automatically integrate all of your technical data history and all data from sensors (weather station, connected drains, humidity sensors, etc.) for simplified management.
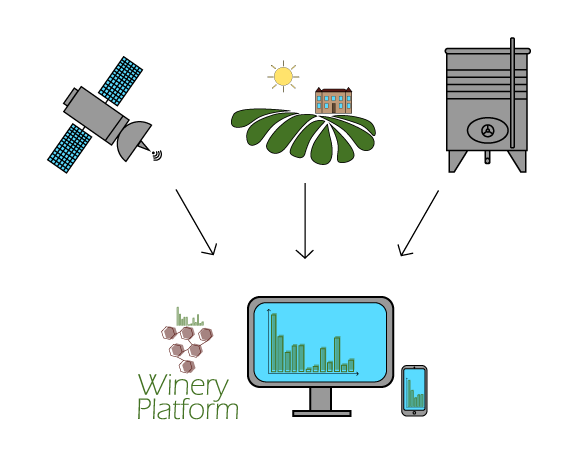
View
Configure a graph in 3 clicks to visualize any type of data at the domain, plot or tank level on the desired time scale (years, months, weeks, days, hours, etc.)
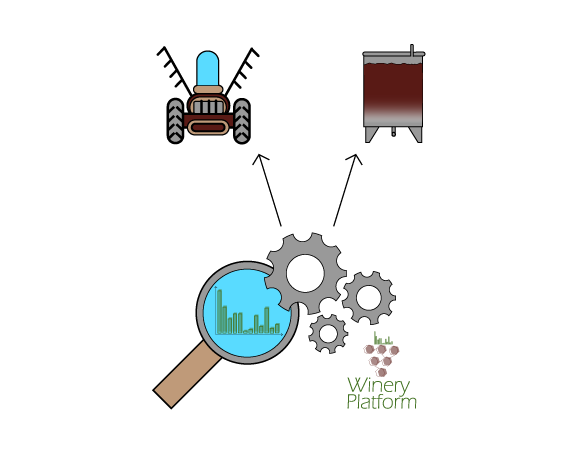
Analyze
Easily compare the different plots or vats on different vintages and find, for example, the closest vintage automatically.
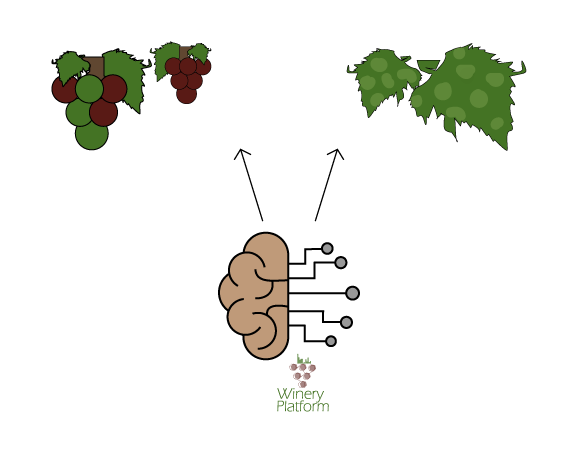
Predict
Thanks to the data collected and the artificial intelligence developed by our services or partners, benefit in 1 click from disease prediction, water stress, phenological statistics…
One of our first customers at the origin of the project, begins to exploit all the power of the software to analyze the impact of weather phenomena on the evolution of phenological stages.
Winery Platform is pleased to partner with Vegetal Signals to make water stress predictions from their model and hydro-score sensor available to users.